A Case Study on Glossier's Social Media Marketing Strategy
#Visualizations
Our team also investigated these datasets through visual exploratory data analysis. The d3 Javascript library was used to build interactive, web-based visualizations. In order to create these visualizations, the data needed to be in a very specific format. Data needed to be cleaned further and created into subsets; we used the R programming language to do this. Cleaned data sets were also fed into and manipulated with Tableau to inspect any obvious trends.
Words Associated with the Hashtag #glossier from 2010 to 2017
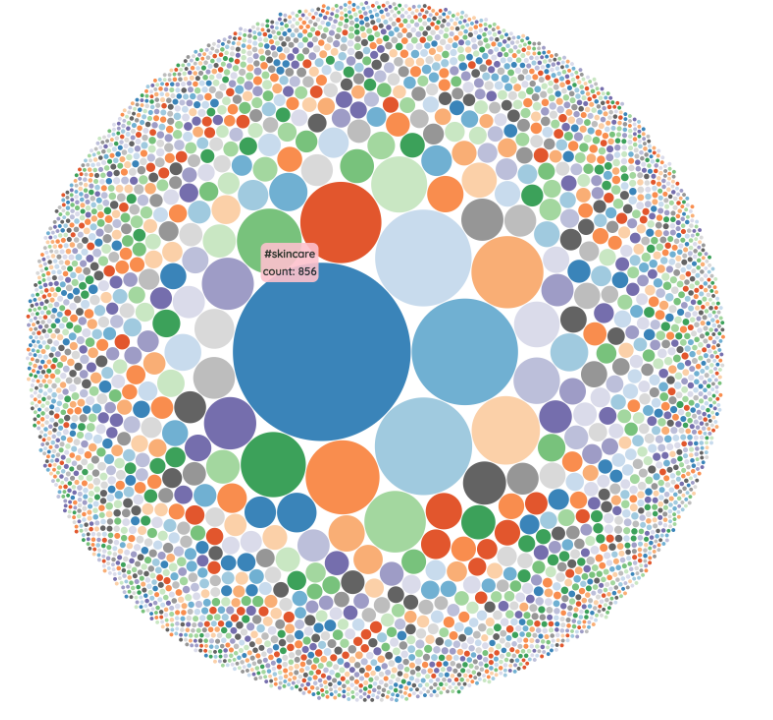
Click here to interact with the visualization.
Frequency of the hashtag #glossier from 2009 to 2017
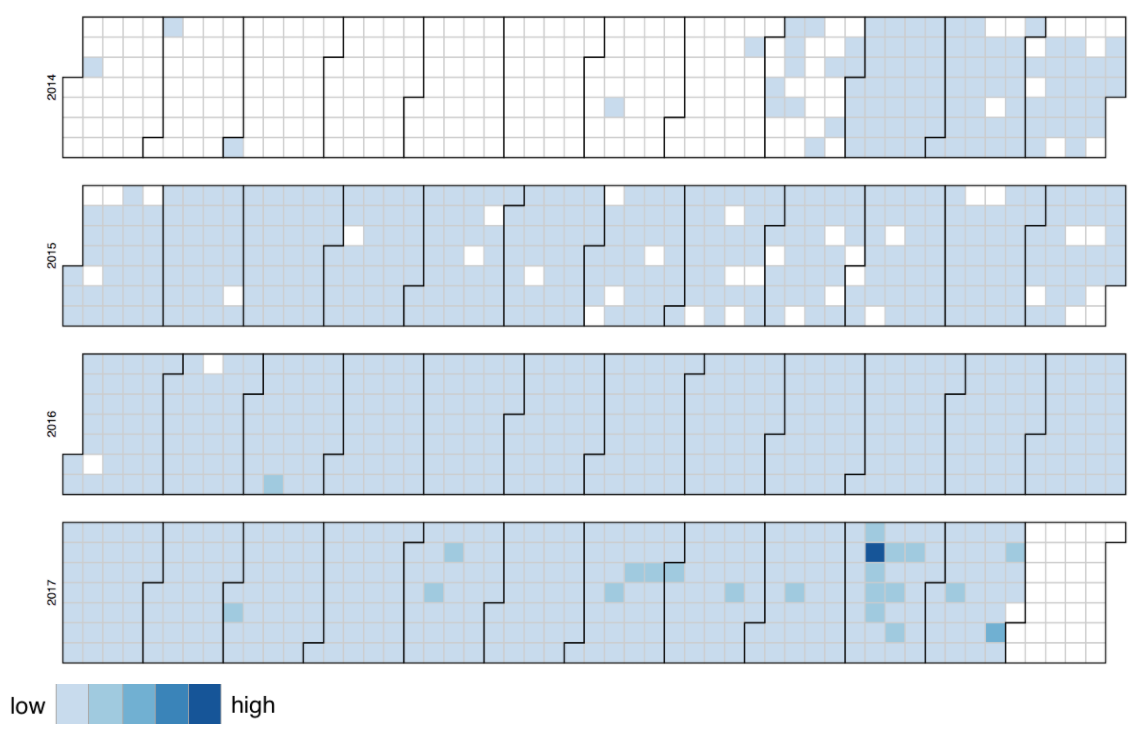
Click here to interact with the visualization.